Unravelling Data Relationships with Correlation
Correlate with Python
Correlation analysis is a fundamental statistical technique used in data analytics to measure the strength and direction of relationships between variables.
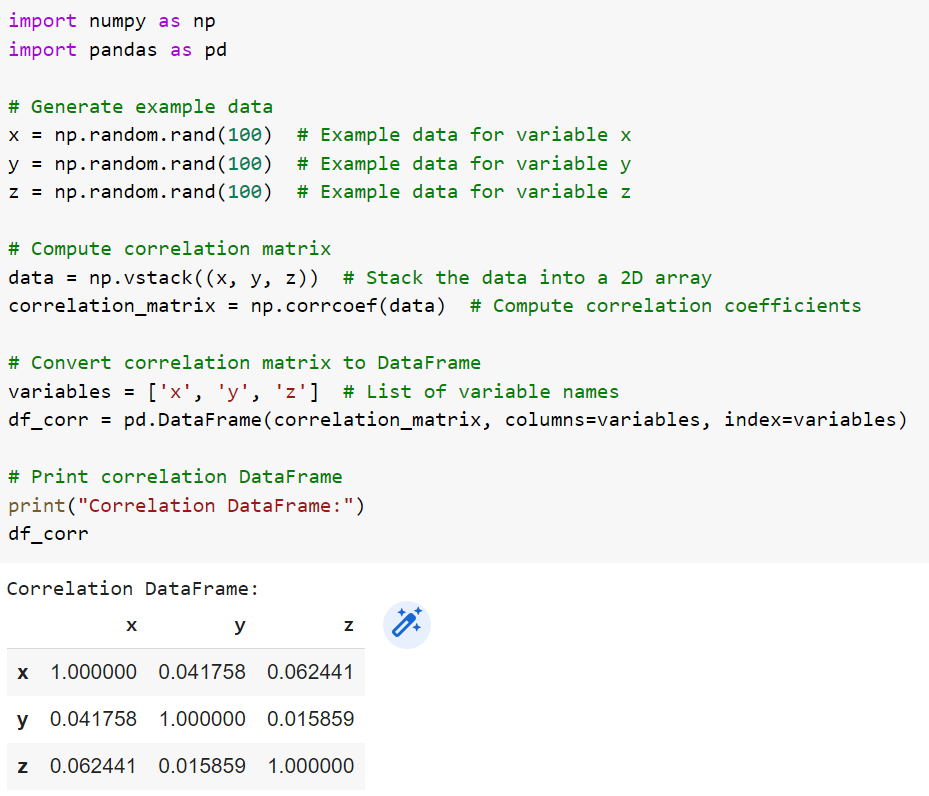
In Python, the most commonly used library for conducting correlation analysis is the NumPy library, which provides the corrcoef() function to compute Pearson correlation coefficients for linear relationships between variables. The corrcoef() function takes in two arrays of data and returns a correlation matrix, where the diagonal elements represent the correlation coefficients between the variables. Positive values indicate positive relationships, negative values indicate negative relationships, and values close to zero indicate little or no correlation. Below is an example.
Apart from Pearson correlation, Python also provides functions to compute other types of correlation coefficients. For example, the SciPy library provides the spearmanr() function to compute Spearman rank correlation coefficients for monotonic relationships between variables. The spearmanr() function takes in two arrays of data and returns the correlation coefficient and p-value, which indicates the significance of the correlation. Kendall rank correlation coefficients for ordinal relationships can be computed using the kendalltau() function from the SciPy library. Below is a heatmap for each of Spearman and Kendall on the same dataset.
Python also provides additional functionalities to handle advanced topics in correlation analysis. Time-series data can be analyzed using libraries such as Pandas and Statsmodels, which offer functions for autocorrelation and cross-correlation analysis. Multiple regression analysis can be performed using the ols() function from the Statsmodels library, allowing for the examination of multiple variables simultaneously. Partial correlation, which measures the relationship between two variables while controlling for the effects of other variables, can be computed using the partial_corr() function from the Pingouin library.
When doing correlation analysis in Python, it is important to consider assumptions, handle missing data, and address outliers. Pearson correlation assumes a linear relationship between variables, and violations of this assumption may result in inaccurate results. In terms of outliers, Matplotlib and Seaborn can be used for visualizing data and thus identifying them. Missing data can be handled using techniques such as imputation or deletion.
Feedback
The Substackers’ message board is a place where you can share your coding journey with me, so that we can exchange ideas and become better together.
Please open the message board and share with me your thoughts!


