Build Distribution Bar Chart with Box Plot
Visualize with Python

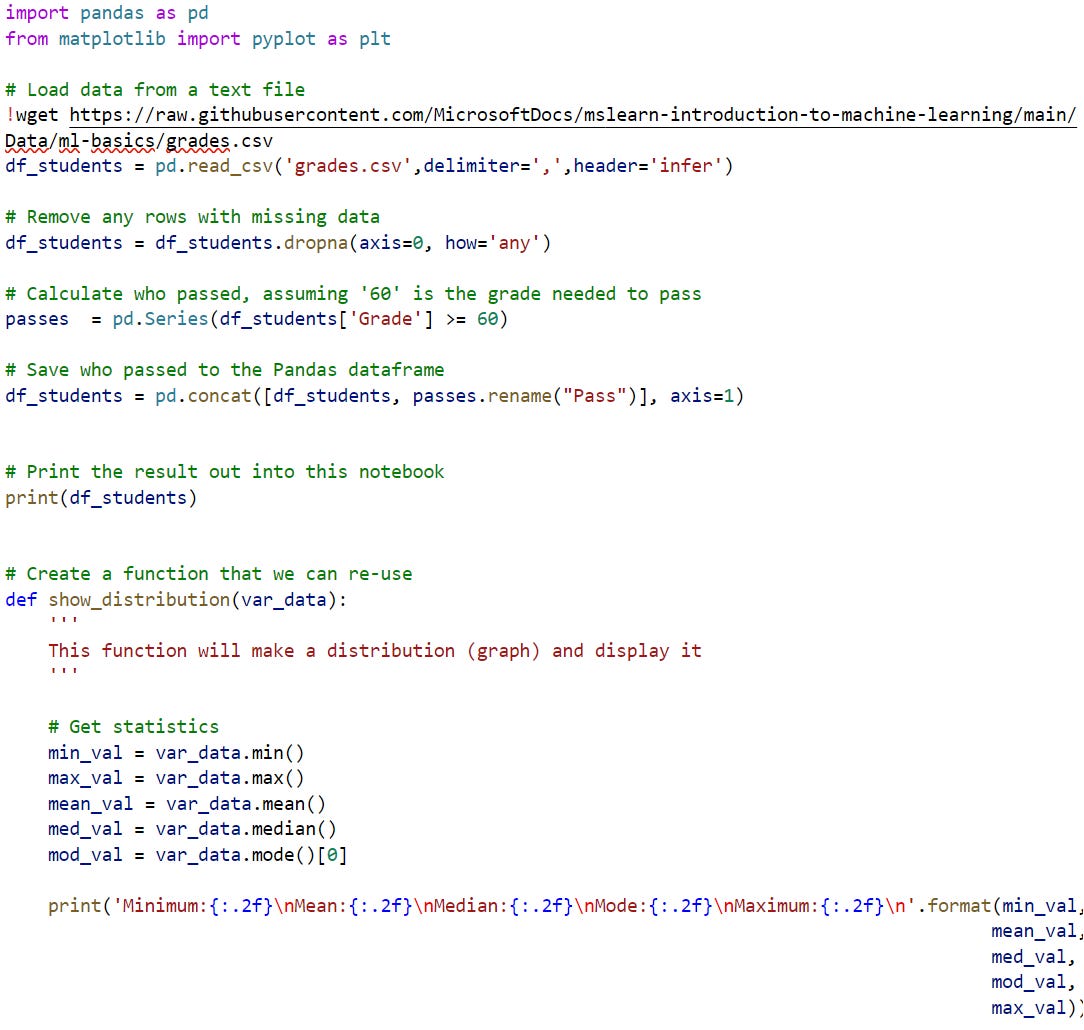
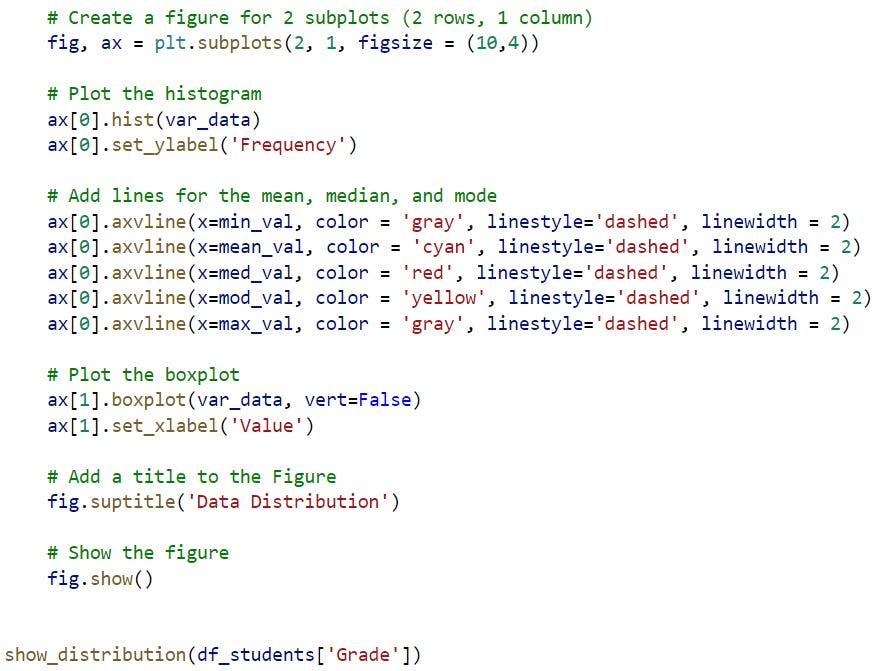
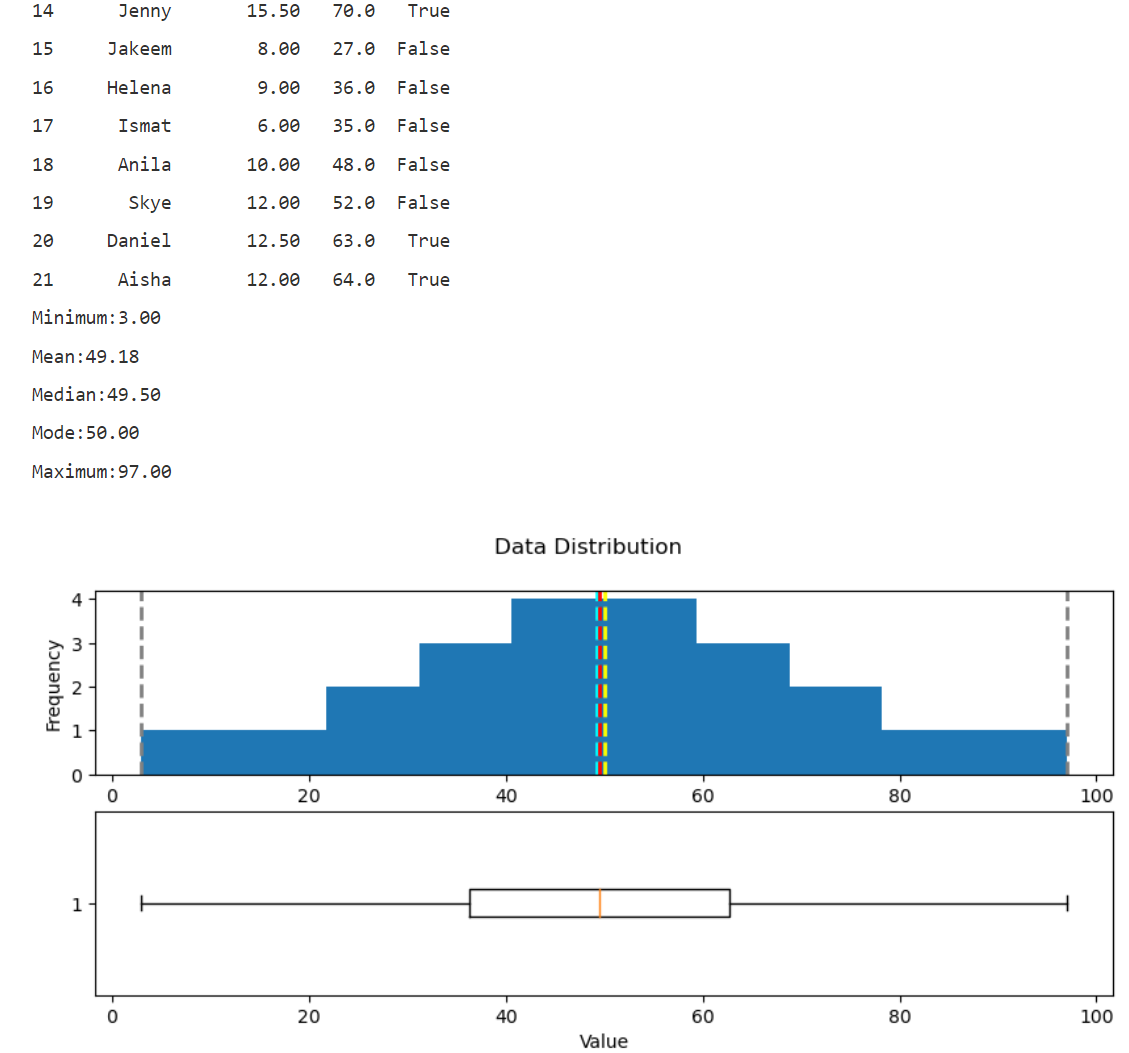
In this post, we are going to put the student grades distribution bar chart and the box plot on one scale, so the statistic distribution would all make sense together.
Feedback
The Substackers’ message board is a place where you can share your coding journey with me, so that we can exchange ideas and become better together.
Please open the message board and share with me your thoughts!